Atlanta BYK spectro2profiler User manual

Measure what you see
Glossary – Explanation of Terminology
spectro2profiler
Glossar – Erklärung der Terminologie

BYK-Gardner GmbH spectro2profiler
2 283 025 846 - 2008
© Copyright 2020 BYK-Gardner GmbH
All rights reserved

spectro2profiler BYK-Gardner GmbH
Table of Contents
English .................................................................................................................................................. 4
Deutsch................................................................................................................................................. 12
283 025 846 - 2008 3

spectro2profiler BYK-Gardner GmbH
4 283 025 846 - 2008
Table of Contents
1 Introduction .............................................................................................................. 5
1.1 Welcome to BYK-Instruments!.................................................................................... 5
1.2 About ........................................................................................................................... 5
2 Measurement Results............................................................................................... 6
2.1 Leather-like Structures ................................................................................................ 6
2.2 Fine Structures ............................................................................................................. 7
2.3 Coarse Paint ................................................................................................................. 8
3 Settings for 3D / 2D Parameters in “smart-chart” ................................................. 9
3.1 Settings for 3D Topography Data (Watershed Analysis)........................................... 9
3.2 Settings for 2D Reflectivity Data ................................................................................ 11

BYK-Gardner GmbH spectro2profiler
283 025 846 - 2008 5
1 Introduction
1.1 Welcome to BYK-Instruments!
Congratulations on the purchase of this top-quality product which you can
100% rely on for your laboratory analysis and QC tasks. BYK-Gardner is com-
mitted to supply innovative and high quality testing solutions with global ser-
vice. BYK-Instruments are known as complete system solutions customized to
your requirements to optimize color, appearance and physical properties of
your products.
We strongly believe in total customer satisfaction including local services on a
global basis. Our BYK-Instruments’ offices and authorized agents can support
you with the following value-added services:
• Technically competent sales engineers - your resource to select the right
testing solution.
• Application engineers - your contact whenever you need technical expert-
ise or operation help.
• Repair & Certification services - your guarantee for a long instrument life-
time.
BYK-Gardner is part of the Altana Group and a direct subsidiary of BYK, the
worldwide leader of additives for coatings and plastics. Together we offer com-
plete and unique solutions for you, our customer.
We thank you for your trust. Let us know what we can do to best meet your
specific needs.
Your BYK-Gardner Team
www.byk-instruments.com
1.2 About
This document describes the meaning of the measurement parameters for the
different analysis modes. In addition, it is explained how to best edit the set-
tings for watershed and reflectivity calculation. The settings can be optimized
in Standard Management of “smart-chart” based on your specific structure /
texture.
Document Type Document Number
Safety Instructions 283 025 448
Short Instructions 283 025 449
Operating Instructions 283 025 450 E
All documents can be downloaded from our website:
https://www.byk-instruments.com/p/7300

spectro2profiler BYK-Gardner GmbH
6 283 025 846 - 2008
2 Measurement Results
Dependent on the selected analysis mode the parameters described in the fol-
lowing chapter are calculated by the spectro2profiler.
In order to optimize the measurement results for your specific structure the
2D / 3D settings can be edited in Standard Management of the “smart-chart”
software.
The firmware uses default settings, if not changed in Standard Management
and sent to the instrument with a specific standard.
2.1 Leather-like Structures
Cn - Number of Cells
The number of cells included into the data analysis. Incomplete border cells are
excluded from the data analysis.
Cs - Mean Cell Size (mm²)
The areas of the included cells are measured and the mean value is calculated.
Ca - Mean Cell Amplitude (P-µm)
The minimum height and the maximum height in each cell are detected. From
these two heights the amplitude of one cell is calculated. The averaged amp-
litudes of all cells yield the mean cell amplitude. The unit is perceived height
based on the measurement technology.
R - Mean Reflectivity (a.u.)
The mean value of the reflectivity data. This is an absolute measurement. The
value is calibrated with a matt white tile. This camera standard is provided as
accessory. The unit is non-standard and thus an arbitrary unit (a.u.).
Rc - Reflectivity Contrast
The topography data is separated into valleys and hills. The threshold height is
parameterized (see below). The algorithm calculates the two mean reflectivity
values for the area of valleys and of hills. The contrast is calculated with the
contrast formula contrast = (hill – valley) / (hill + valley).
Rh - Reflectivity on Hills (a.u.)
This is the mean reflectivity value for the area of hills.
Rv - Reflectivity in Valleys (a.u.)
This is the mean reflectivity value for the area of valleys.

BYK-Gardner GmbH spectro2profiler
283 025 846 - 2008 7
Hs - Mean Hill Size (mm²)
The cross sections of the hills within the corresponding cells are detected. These
areas are averaged and the mean value is returned. The threshold height for
the cross section is parameterized (see below).
F% - Fill Factor
The ratio of mean hill size and mean cell size yield the fill factor.
CsMin - Cell Size Minimum (mm²)
The smallest cell size of all cells included into the data analysis.
CsMax - Cell Size Maximum (mm²)
The largest cell size of all cells included into the data analysis.
CsDev - Cell Size Deviation
The standard deviation (mm²) of the cell sizes divided through the Mean cell
size (mm²). The standard deviation is calculated based on the of the distribu-
tion of all individual cell sizes. Division by mean value ensures the comparabil-
ity of different structure types.
2.2 Fine Structures
R - Mean Reflectivity (a.u.)
The mean value of the reflectivity data. This is an absolute measurement. The
value is calibrated with the matt white tile. This camera standard is provided as
accessory. The unit is non-standard and thus an arbitrary unit (a.u.).
µRc - Micro Reflectivity Contrast
The topography data is separated into low and high reflectivity areas. The al-
gorithm calculates the two mean reflectivity values for the corresponding
areas. The contrast is calculated with the contrast formula contrast = (high –
low) / (high + low).
µPd - Micro Mean Peak Distance (µm)
The algorithm finds local maxima. The next neighbour distances for these max-
ima are calculated and an average value is returned.
µA - Micro Mean Local Amplitude (P-µm)
The algorithm finds local maxima and local minima. A local amplitude is calcu-
lated between a local maximum and its nearest minimum. All local amplitudes
are averaged, and the result is returned. The unit is perceived height based on
the measurement technology.

spectro2profiler BYK-Gardner GmbH
8 283 025 846 - 2008
2.3 Coarse Paint
Cn - Number of Cells
The number of cells included into the data analysis. Incomplete border cells are
excluded from the data analysis.
Cs - Mean Cell Size (mm²)
The areas of the included cells are measured and the mean value is calculated.
Ca - Mean Cell Amplitude (P-µm)
The minimum height and the maximum height in each cell are detected. From
these two heights the amplitude of one cell is calculated. The averaged amp-
litudes of all cells yield the mean cell amplitude. The unit is perceived height
based on the measurement technology.
CsMin - Cell Size Minimum (mm²)
The smallest cell size of all cells included into the data analysis.
CsMax - Cell Size Maximum (mm²)
The largest cell size of all cells included into the data analysis.
CsDev - Cell Size Deviation
The standard deviation (mm²) of the cell sizes divided through the Mean cell
size (mm²). The standard deviation is calculated based on the of the distribu-
tion of all individual cell sizes. Division by mean value ensures the comparabil-
ity of different structure types.
BYK-Gardner GmbH spectro2profiler
283 025 846 - 2008 9
3 Settings for 3D / 2D Parameters in
“smart-chart”
In order to optimize the 3D / 2D measurement results for a specific structure
the following parameters can be adjusted in the Standard Management
module of “smart-chart”.
3.1 Settings for 3D Topography Data (Watershed
Analysis)
Segmentation parameter
… smoothes the surface topography to avoid over / under segmentation. The
true data for the 3D analysis is not affected. The parameter range is from 1.0 to
100.0. The default setting is 10, which is also used in the instrument
firmware.
If the filter offset = 1, a strong smoothing of the input data will take place. If
the filter offset = 100, little smoothing will be done.
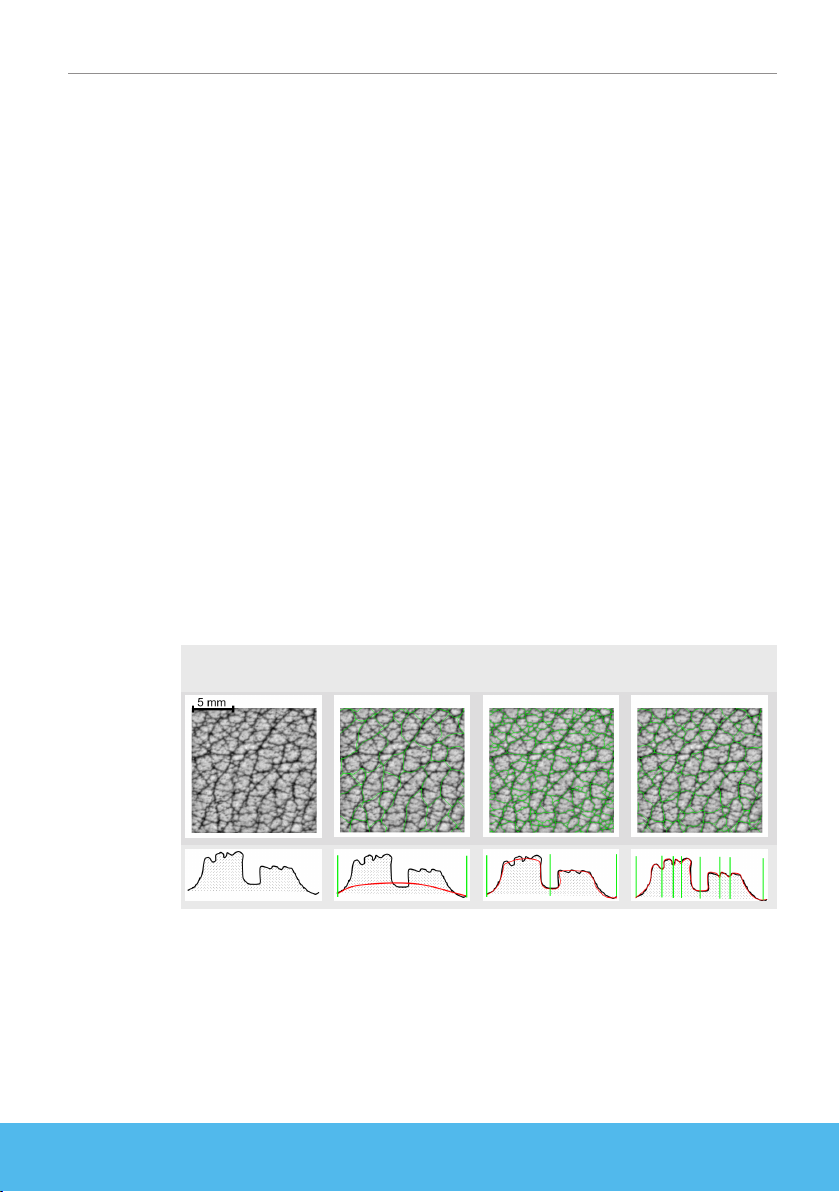
Examples:
The left image in the figure shows the 3D data as a grey scaled image. The im-
ages next to it show different segmentation results for different segmentation
parameters. The green lines indicate the watershed segmentation results. The
images below show the smoothed topography as red line and the segmenta-
tion borders as green lines, illustrated in abstracted form.
Segmentation = 5
Under Segmentation
Segmentation = 10
Good Segmentation
Segmentation = 25
Over Segmentation
spectro2profiler BYK-Gardner GmbH
10 283 025 846 - 2008
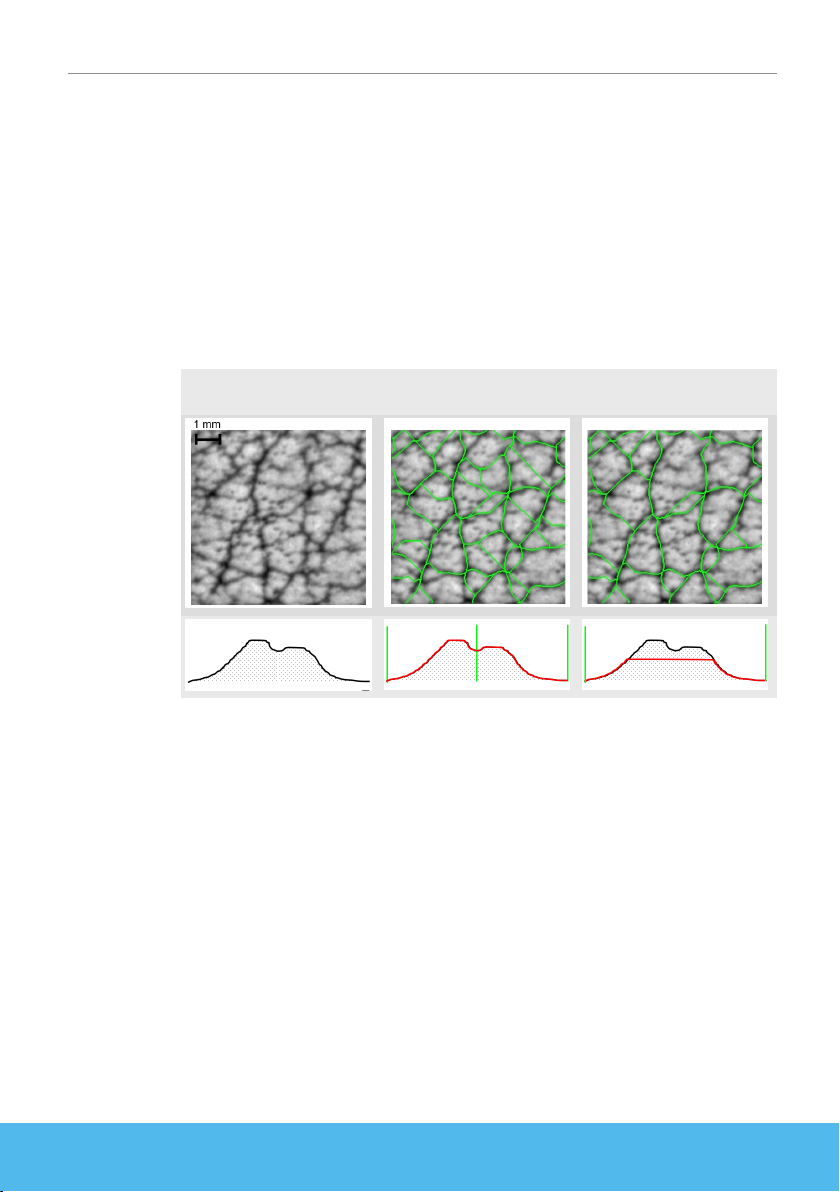
Plateau parameter
… controls the truncation of the crests of the hills. This data manipulation af-
fects the watershed segmentation on the hills. The data for the 3D analysis is
not affected. The parameter range is from 0.0 to 1.0. The default setting is 1,
which is also used in the instrument firmware.
If plateau parameter = 1, no truncation will be done. If plateau parameter = 0,
the crests of the hills will be flattened down to their mean height. The images
underneath show the truncated topography as red line and the segmentation
borders as green lines, illustrated in abstracted form.
Examples:
The following images show the truncated topography as red line and the seg-
mentation borders as green lines, illustrated in abstracted form.
Plateau = 1.0
Over Segmentation
Plateau = 0.3
Good Segmentation
Hill size threshold
… defines the height of the hill intersection for the hill size calculation. The
range is from -1.0 to +1.0. The default setting is 0, which is also used in
the instrument firmware.
Hill size threshold = 0 means that the mean height of the topography is used as
threshold. A value of -1.0 means that the lowest point is used as threshold. This
selects all data as hills. A value of +1.0 generates the opposite output. The rel-
ative threshold parameter ensures the comparability between different
samples.
Examples:
Hill sections are indicated as red areas. The green lines are the watershed seg-
mentation result. The abstracted illustrations above show the intersection
marked as red line and the segmentation borders as green lines.
Other manuals for BYK spectro2profiler
2
This manual suits for next models
1
Table of contents
Languages:
Other Atlanta Measuring Instrument manuals

Atlanta
Atlanta BYK spectro2profiler User manual

Atlanta
Atlanta BYK m200 User manual

Atlanta
Atlanta BYK byko-cup M User manual

Atlanta
Atlanta BYK spectro2profiler User manual

Atlanta
Atlanta ASF 2045 User manual

Atlanta
Atlanta BYK byko-test lite User manual

Atlanta
Atlanta BYK a200 User manual

Atlanta
Atlanta BYK Acquire Color Compact Manual

Atlanta
Atlanta BYK byko-test User manual


